Donut Lab Hot Cycle Test #2: A first look at the 100,000 cycle claim
Michael Plews
The latest drop from Donut Lab is in and its high temperature discharge. This test shows a cell completing both an 80°C discharge, and a 100°C discharge.
There are accepted testing standards for temperature stability in both IEC and UL specifications. It should be noted that this was not the testing protocol that was used here. It is also curious why after the first high temperature discharge, the standard 1C discharge is replaced with a C/2 discharge, except when the test is over. Any elevated operating temperature should minimally affect the performance of the cell, and should not permanently de-rate it.
But there is something else that we saw for the first time in this drop: multiple standard cycles. This means we can start thinking about the 100,000 cycles claim.
Coulombic Efficiency and 100,000 cycles
When a cycle life value is promoted, it is usually with the claim of x cycles with 80% capacity/energy retention. At the time of writing, the Donut Lab website claims only “100,000 cycles designed”. This begs the question: how can you prove this?
There are two main considerations when looking to predict cycle life:
Coulombic Efficiency
any degradation failure modes that may exist between cycle 1 and cycle 100k.
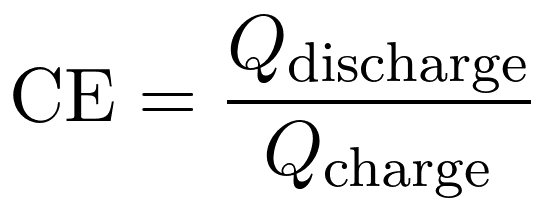
Coulombic efficiency is the measure of ‘number of electrons out / number of electrons in’, or in the more formal equation, where Q represents capacity:
We do see 5 complete cycles in this test, and capacities are reported. This means we can calculate coulombic efficiency numbers. The following table is calculated from the raw data (extracted through the released pdf from VTT). The numbers match those reported in table 4 and 5 of the report.
Cycle | Discharge Capacity / Ah | Charge Capacity / Ah | Coulombic Efficiency / % |
0 | - | 25.660 | - |
1 | 24.872 | 24.917 | 99.8 |
2 | 27.481 | 27.708 | 99.2 |
3 | 25.771 | 25.801 | 99.9 |
4 | 27.611 | 27.746 | 99.5 |
5 | 11.999 | - | - |
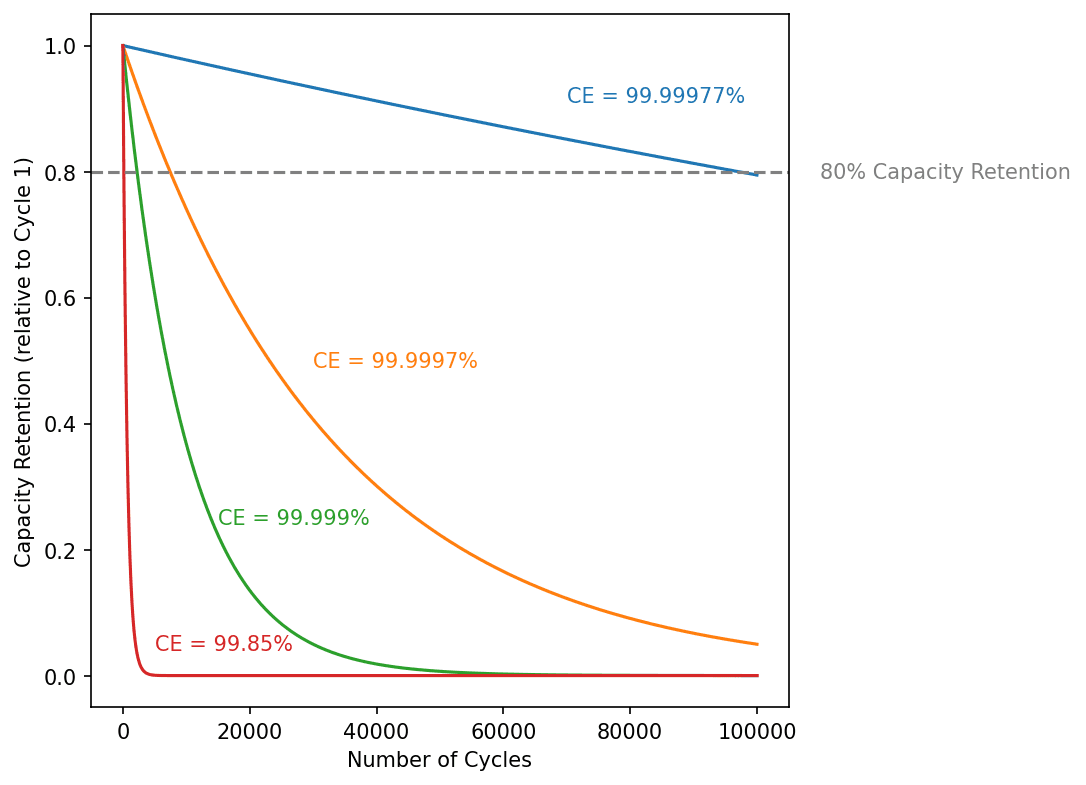
For these values to be 100%, we would need a perfect system that does not lose active material to any degradation mechanism; thermodynamic or kinetic. This is, of course, impossible to design, but with an efficient enough system you can achieve 100,000 cycles. We can calculate how efficient the system would need to be to achieve >80% capacity fade at 100,000 cycles using the compound depreciation equation and solving for y:

The value of y (or CE) that satisfies this equation is 99.99977%, and those decimal places matter! To illustrate this, here is some modeled data with coulombic efficiency of 99.99977%, 99.9997%, 99.999%, and 99.85% (the average of all 20°C cycles in this experiment):
Why we can’t rule out CE ≥ 99.99977%
VTT at the beginning of each report has published the cycler brand and accuracy measurements (Table 2 in the report). The voltage measurement accuracy is 0.005% fsd (full scale deflection) across a 0-5V range, meaning the voltage measurement accuracy is ± 250µV, negligible for this study.
For the current measurement accuracy, this is a little higher; 0.03% fsd. This is also more complicated due to the auto-range switching, meaning when we are measuring current between 5-50A, our measurement accuracy is 0.03% of 50A, or 15mA, and when our current decays to C/20, or 1.3A, we switch to 0.5-5A it becomes 1.5mA.
So how does that affect our integration to current over time in Ah? We could write a whole other blog on this, but instead I’ll summarize by saying we are integrating current over time using the trapezoid rule, and for each trapezoid our error sums by the following:
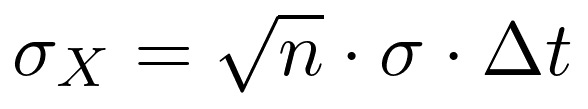
Where σX is the standard deviation of the integrated result, n is the number of measurements, σ is the std.dev. of each measurement, and the ∆t is the time interval between measurements. We are assuming no or negligible error in time measurement.
This puts our error for each measurement in the following table, as well as propagating our error to coulombic efficiency:
Cycle | Discharge Capacity / Ah | Error in Discharge Capacity / mAh | Charge Capacity / Ah | Error in Charge Capacity / mAh | Coulombic Efficiency / % |
0 | - | 25.660 | ± 0.435 | - | |
1 | 24.872 | ± 0.377 | 24.917 | ± 0.435 | 99.8 ± 0.0033 |
2 | 27.481 | ± 0.425 | 27.708 | ± 0.465 | 99.2 ± 0.0031 |
3 | 25.771 | ± 0.591 | 25.801 | ± 0.451 | 99.9 ± 0.0040 |
4 | 27.611 | ± 0.600 | 27.746 | ± 0.458 | 99.5 ± 0.0038 |
5 | 11.999 | ± 0.278 | - | - |
Notice anything here? The error in charge capacities for charge are generally lower and more consistent than those over discharge. This is due to the automatic switch in the CV step, when the current decays to the next range, increasing absolute accuracy of the measurements. This is not present in the discharge step (which is common). Skipping these critical conditions can hurt your data collection. Most labs track protocol variations in spreadsheets or engineer notebooks. When you're running tests across different cycler brands and cell sizes, one forgotten detail - like missing the CV current-range switch - tanks your data quality. This is why Ohmic Labs makes it easy to consistently document and reuse protocols across multiple cell sizes and instruments. Version control for battery testing.
These calculations show our coulombic efficiency error due to current measurement accuracy does not give a range that contains 99.99977%. However, it does show that the coulombic efficiencies cycle to cycle are themselves different from each other by more than the measurement error, highlighting outside contributions (temperature, for one) are likely a much bigger impact on the inconsistencies.
Additionally, there are often early cycle changes in cell before a steady state takes over, meaning early cycles will show capacity fade faster than the later cycles. This paper contains many examples. To combat this, coulombic efficiency errors are usually fit over time using a polynomial. Biologic does a great job describing as such in their blog here.
Regardless, there is a bigger concern than looking at just the coulombic efficiency, and that is the ‘capacity knee’ - a sudden, rapid increase in irreversible loss of capacity common with lithium-ion batteries. This problem is so common that they are entire subjects of study within the academic and industrial battery communities. However the approaches to these require testing, at least prototype devices, out to such high cycle counts to validate this failure mechanism either is or isn’t present, or was or wasn’t detected by ML/predictive methods.
Why we can rule out 100,000 cycles
The shortest 1C-1C cycle time in this experiment was 4.7 hours, assuming this is the cycle the 100,000 cycle claim is made against. For Donut Lab to publish data on 100,000 cycles, they would have had to start testing 53 years ago, in 1973. For you history buffs out there, this was before the first demonstration of lithium intercalating with graphite.
Ultimately, ‘100,000 cycles designed’ is likely doing a lot of heavy lifting here. There is not a way I know that the claim ‘100,000 1C-1C cycles to 80% capacity retention’ could currently be proven, only the above methods and careful control of your testing protocols could create evidence it is possible.
Check out more of our articles:
Ready to take your battery lab to the next level?
At Ohmic Labs we believe we can help you learn faster for less. Book a call with us today to level-up your battery test operations.